Results Desktop
EASY v2.0 offers a variety of plot utilities over the results of the
algorithm, either during the evolution, or in the end of it. To activate
EASY v2.0 Results window during or in the end of the evolution, the user has
to press the button Results Desktop in the Run & Results tab of EASY frame.
Results are shown in real time, so no refresh command is actually needed.
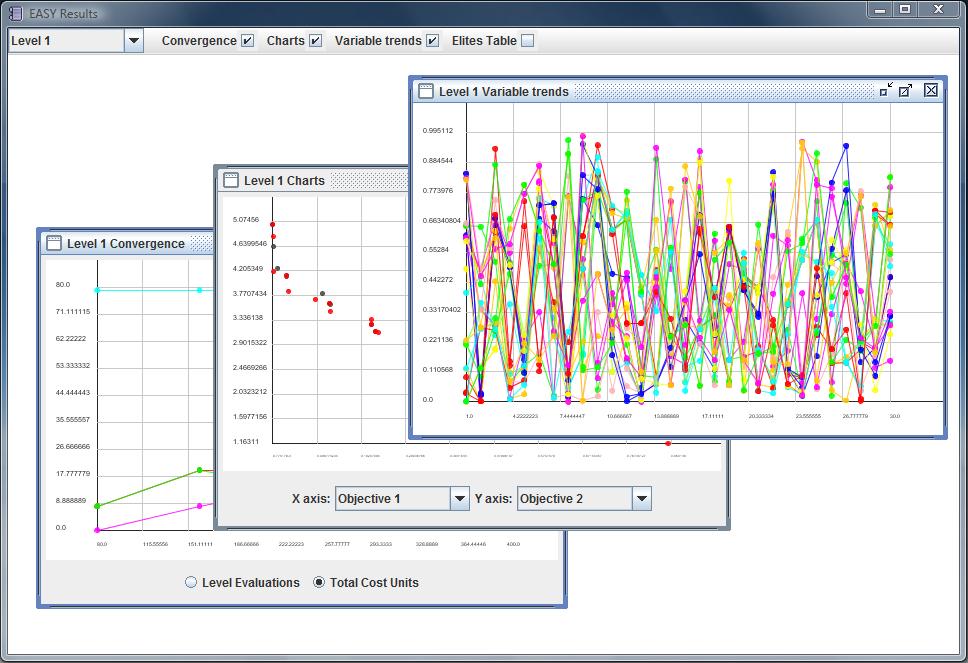
Internal Control Bar
From the internal Control Bar, the user is able to select a level from
the Level combo box and, by ticking in the corresponding check boxes, to
watch, in independent internal windows, the algorithm's Convergence,
various Charts (for instance the Pareto Front), the Variables trends
and the Elites Table.
More than one level can be viewed in the same time. For the internal windows
tooltip popups are available, explaining briefly the view. However, as
follows, each plot is analyzed in details.
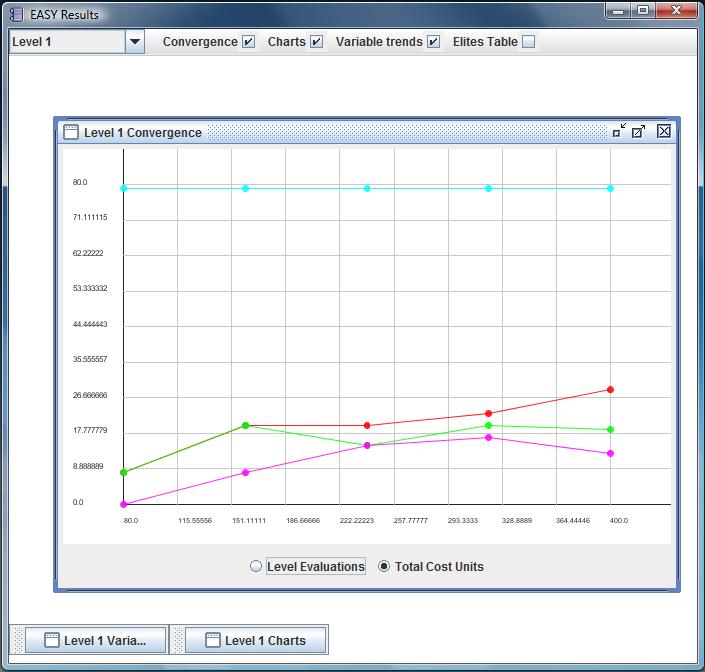
Convergence
In single objective problems, the convergence plot shows off the fitness
value of the best individual (y-axis) towards either Total Cost Units
or Level Evaluations (x-axis) with a red continuous line and points.
However, in multi objective cases, the evolution in elites' population is
analyzed in this plot. The four coloured lines appeared correspond to:
Cyan: Maximum number of elites.
Red: Current number of elites.
Green: Elites added versus Cost.
Magenta: Elites removed versus Cost.
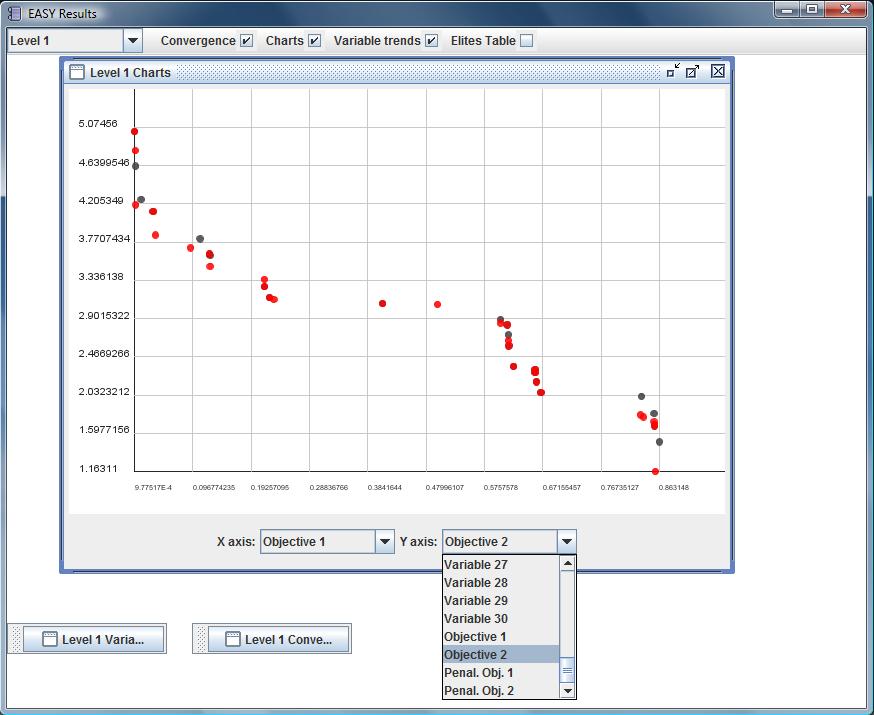
Charts
Pareto front is a 2D plot, which shows by default the results on the
first two objectives' space. However, the user may change the view, by
selecting other Objective, Variable or Constraint from the X axis and
Y axis combo boxes. This window is always disabled for single
objective cases. The different coloured points correspond to the current and
former generation:
Red points: Current front individuals.
Gray points: Previous front individuals.
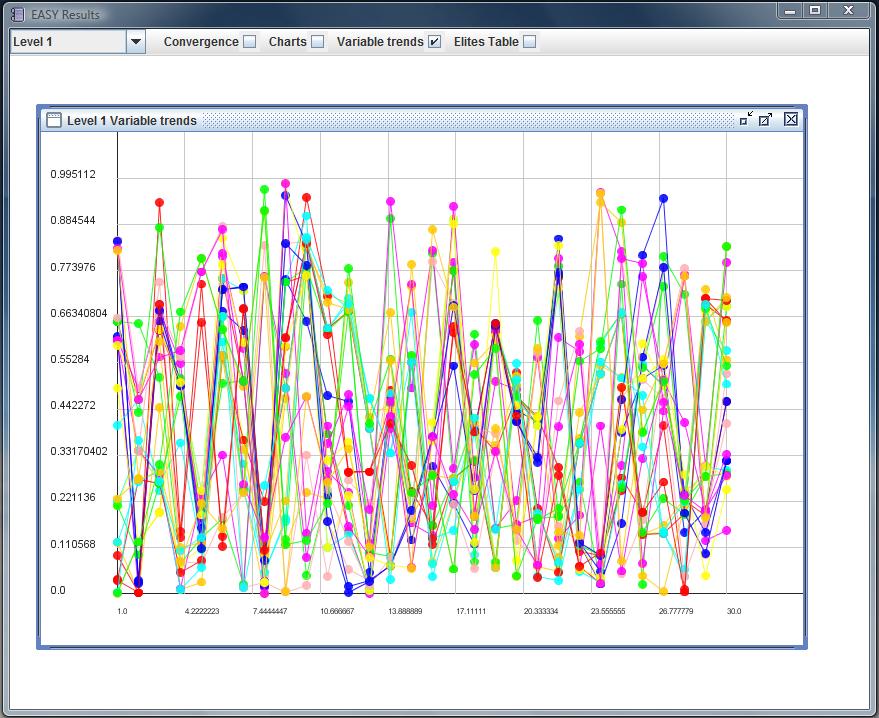
Variable Trends
This window shows off the nondimensionalized variables' values (Y axis) of
the elites, using a different coloured line for each individual (X axis).
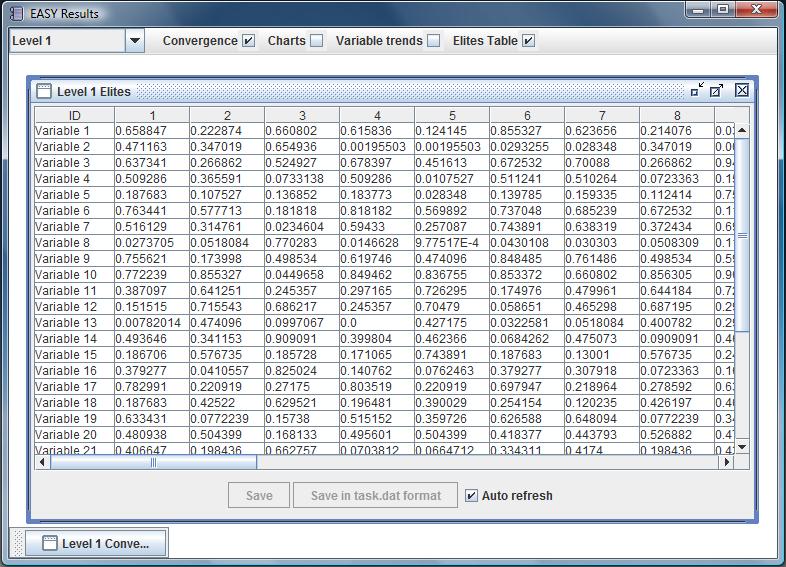
Elites Table
On the control's choice Elites Table, the optimization results are displayed
in columns which are sorted depending on the first objective value. Their
number is equal to the number of maximum elit individuals to keep which is
defined, for the corresponding level in the Evolution Parameters/Level
settings/Population tab. Each time the results are auto refreshed, unless
the user sets unselected the Auto Refresh check box. A selected result
(column) may be saved to the disk by pressing the Save button or Save in
task.dat format in disk, in order to have the opportunity to re-evaluate
this solution by executing the corresponding batch file.
Hint:
In all the graphs the user can save the image in the clipboard to use it in
reports by right-clicking with the mouse on the graph. A pop-up menu appears
with options for copying data to the clipboard and viewing the about box.
|